
I have been tracking the price of Internet Transit since 1998, and as you can see from Table 2-2 and Figure 2-4, the prices for Internet Transit have dropped every year.
Table 2-2. U.S. Internet Transit Prices (1998–2014) Historical and Projected
![]()
It is worth pointing out that these data have always generated heated debate in the peering coordinator community.
Notes from the field.
Internet Transit Pricing Data and Controversy
The controversy over these numbers is related to the variability in service offerings and pricing. Further, the pricing schedules are often protected under a nondisclosure agreement (NDA), and generally not publicly available to systematically analyze. Some ISPs consider many variables when determining pricing. They might, for example, account for the number and size of the ports requested, type of the customer traffic (inbound vs. outbound), how that traffic would impact the ISP, the region(s) and market conditions at the location of the interconnection, etc. For these reasons, many would argue that there is no single market price for Internet Transit. The data are inherently flawed.
And they have a valid point.
My data are anecdotal and based on a variable and small sample size, polling maybe 30–50 people three to five times a year. The transit price points are collected on an ad-hoc basis at operations conferences that I attend every year. I ask ISPs and transit customers, “What is the going price for transit these days?” From the dataset I throw out the outliers and select the middle from the mass of numbers that fall within a narrow range.
However flawed this manual measurement system is, it remains one of the very few longitudinal measures of the market price for transit. Some of these measurements were based on or validated by contributed ISP pricing sheets. One can say “according to the conversations Bill has had with ISPs over the years, the transit prices have dropped roughly like this line.” I would not recommend taking these numbers as anything but very rough indications—and a better mechanism is on its way as we start measuring in $/Gbps.
Besides, to focus on the individual data points is to miss the point.
The point is that the trend is unmistakable, and no one would disagree—because transit prices have dropped every year.
The other interesting thing I noticed is that every year the ISPs say to me things like, “Transit prices can’t get any lower,” and “No one is making any money at these prices.” And every year, the prices drop again.
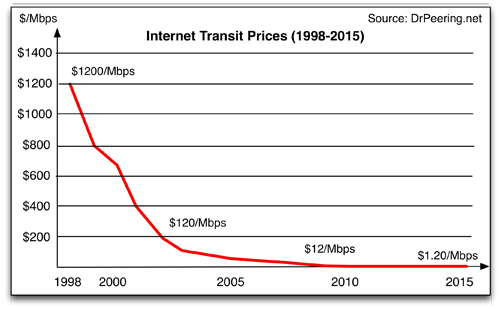
Figure 2-4. Internet Transit prices historically decline every year.
The good news for ISPs is that Internet traffic volumes have always grown as well, and all indications are that this trend will continue for some time. Even though the price of transit has declined by around 30% per year, Internet traffic typically increases by more than 50% per year.
There is also some debate within the community on the qualitative differences between transit from a lower-priced provider and the Internet transit service delivered from a higher-priced provider. Higher-priced providers would argue that they have better-quality equipment (routers vs. switches, etc.), and better and more sustainable operations procedures that simply cost more to operate. They would argue that “you get what you pay for in the transit market”. They could be right, but I would also point out that I have not met very many paying customers complaining about the quality of service of lower-priced providers.
DrPeering.net ©2014 | Privacy Policy | Terms and Conditions | About Us | Contact Us
The 2014 Internet Peering Playbook is now available on the iPad at the Apple Store and for the Amazon Kindle. The Kindle, ePub and PDF form are also perpetually updated on the DrPeering DropBox share.